

This case study shows how a well-run serviced-apartment property in central Ljubljana grew its rate and room revenue three years in a row, starting from close to 90% occupancy, with no renovations and more new rooms opening in the city every year.
The property is not named. Results are shown as percentages or indexed to a base year.
Starting Point
We started working with the property in March 2024. This was not a rescue job. The owner is an experienced hotelier, largely self-taught, who knew the PMS and the OTA extranets inside out. Core revenue management practices were already in place, and 2023 was a strong year by any market standard, with occupancy at 89.5%.
So the brief was clear: find incremental, sustainable upside in an operation that was already doing most things right.
Market Reality: Rising Supply in Ljubljana
Over the past few years, Ljubljana has seen a significant increase in accommodation supply:
- ~3,900 hotel rooms currently in the city
- ~1,700+ short-term rental units
- ~1,000 new hotel rooms added between 2019 and 2024
- ~500 additional rooms already planned or under development
| Category | Hotel rooms | Rooms in the city centre | Hotels in the city centre | Hotels outside the city centre |
|---|---|---|---|---|
| 5* | 534 | 534 | 3 | 0 |
| 4* | 2,462 | 1,382 | 19 | 13 |
| 3* | 825 | 532 | 12 | 11 |
| Budget | 89 | 0 | 0 | 2 |
| Total | 3,910 | 2,448 | 34 | 26 |
In a market like this, ADR growth gets harder every year, especially for a property that is already full most nights.
Results
All figures below are for the whole property, room revenue excluding VAT.
| Year | Occupancy | ADR index | Room revenue index | RevPAR index |
|---|---|---|---|---|
| 2023 actual | 89.5% | 100.0 | 100.0 | 100.0 |
| 2024 actual | 92.8% | 104.1 | 108.3 | 108.0 |
| 2025 actual | 95.8% | 109.4 | 117.1 | 117.1 |
| 2026 FC | 93.7% | 125.1 | 130.9 | 130.9 |
Two things stand out. Occupancy went up first: from 89.5% in 2023 to 92.8% in 2024 and 95.8% in 2025, and around 94% this year (FC). After that, the growth came from rate. By the end of 2026 we expect ADR to be about 25% above 2023 and room revenue about 31% higher (2026 FC).
Key point:
ADR growth was achieved without any product upgrades or investments, purely through pricing, restriction and channel optimisation.
Summer: Full Every Year, So the Rate Had to Do the Work
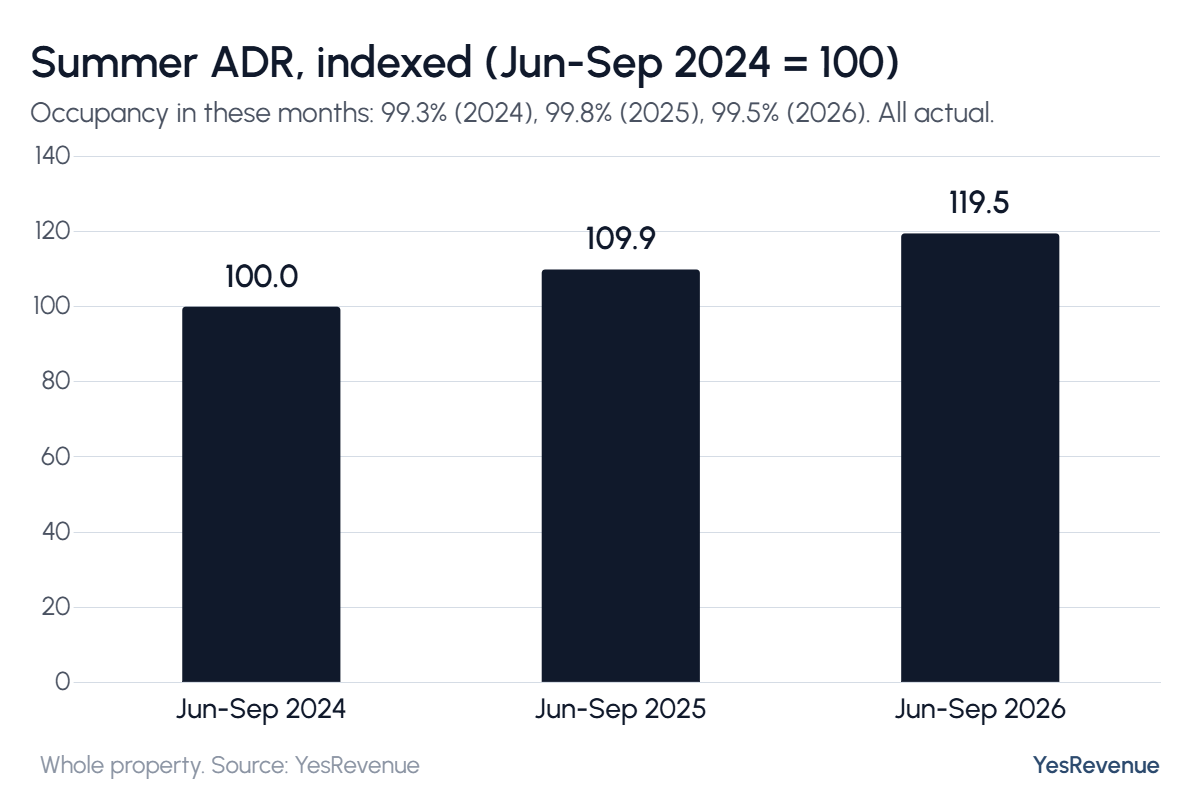
From June to September the property was practically sold out in all three years, with occupancy between 99.5% and 99.7%. There was simply no more volume to win in those months. ADR in the same four months grew by almost 20% between 2024 and 2026.
2026 So Far
January to September 2026 against the same months of 2025, both actual: room revenue +11.0%, ADR +13.0% and RevPAR +11.0%. Occupancy came in 1.7 points lower. All of that drop was in January and February, where ADR was 23% higher than a year before and room revenue still grew.
Year After Year
The same nine months, compared year after year:
| Whole property | Jan-Sep 2024 | Jan-Sep 2025 | Jan-Sep 2026 |
|---|---|---|---|
| Occupancy | 91.8% | 96.1% | 94.4% |
| ADR index | 100.0 | 102.8 | 116.2 |
| Room revenue index | 100.0 | 107.2 | 119.0 |
| RevPAR index | 100.0 | 107.6 | 119.5 |
| Room revenue after commission, index | 100.0 | 108.2 | 120.4 |
| Room nights booked 30+ days ahead | 38.0% | 29.3% | 49.8% |
| One-night stays, share of stays | 60.0% | 54.9% | 53.8% |
| Non-refundable, share of room nights | 18.6% | 17.9% | 21.7% |
| Website, share of room revenue | 4.8% | 6.4% | 6.3% |
What Drove the Performance
ADR-first strategy
Focus shifted from “filling the calendar” to selling the right nights at the right price, particularly during compression and shoulder periods.
Smarter restriction management
- Refined minimum stays and arrival/departure rules
- Better calendar compression
- Higher revenue density per available night
Healthier bookings
- Half of the room nights in January to September 2026 were booked at least 30 days ahead, up from 38% in 2024: a steadier base to price from
- One-night stays down from 60% to 54% of stays; stays of three nights or more up from 14% to 18%
- Average length of stay up from 1.70 to 1.78 nights
- Non-refundable share of room nights up from 18.6% to 21.7%. Non-refundable bookings cancel at 3-4% of room nights, flexible ones at 20-25%
A broader channel mix
- Expedia grew from 3.6% to 10.0% of room revenue (Jan-Sep 2024 vs 2026), at the highest ADR of the main channels
- Booking.com went from 65.6% to 62.7% of room revenue, so the property depends less on a single channel
- The website grew from 4.8% to 6.3% of room revenue; still a small slice, and the clearest lever for the next two years
- Commission went from 14.6% to 13.6% of room revenue, so room revenue after commission grew 20% between Jan-Sep 2024 and Jan-Sep 2026
Every day of the week earned more
- Friday and Saturday ADR up 21% between Jan-Sep 2024 and Jan-Sep 2026
- Sunday to Thursday ADR up 14% over the same period
Why This Case Matters
In a city where accommodation supply keeps growing, ADR discipline is the true differentiator.
This case shows that:
- High occupancy does not equal optimal revenue
- Even a property run by an experienced, hands-on owner has untapped upside
- Structured revenue management delivers measurable gains without CAPEX
Looking Ahead
With a higher ADR base, a growing website and better booking behaviour, the property is well positioned to keep growing in 2027, even as the Ljubljana market gets more competitive.
Curious what the numbers could look like for your property? Book a free Performance Assessment Call.
Figures: whole property, room revenue excluding VAT. 2023 to 2025 and January to September 2026 are actuals; October to December 2026 is our forecast (FC) as of 1 October 2026. 2023 occupancy is calculated from the property’s 2023 room revenue and ADR.